In this article, Jordan Roy-Byrne from Investing.com interestingly compares the price developments of gold and silver to similar periods experienced in history. The summary is a direct translation of the original English article.
During the recent bear market years* (it's nice to be able to write this right now), I often compared the price declines of gold, silver, and gold stocks to their previous history. It helped visualize how deep we were in an endlessly feeling bear market and anticipate when the bear market would finally end.
Now, thankfully, that phase is behind us. It is time to compare the recently experienced uptrend to past phases.
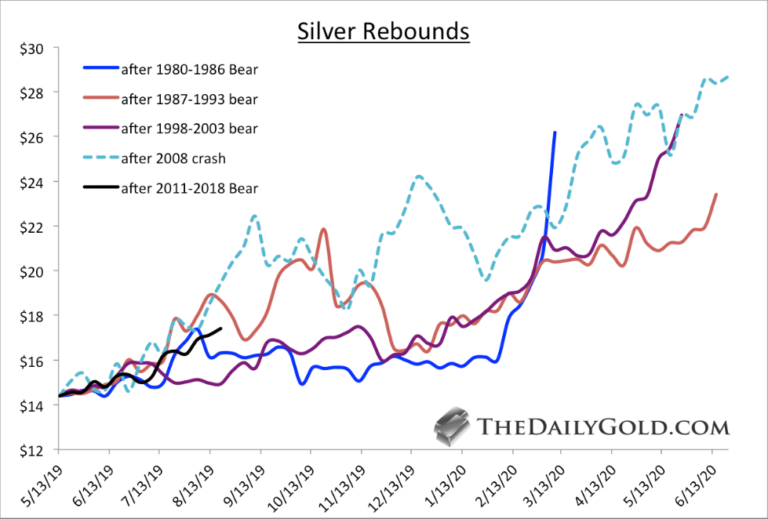
On the price development of silver
The recent low price of silver is very comparable to several similar previous phases in 1986, 1993, and 2003.
We also included the lows from 2008 in the picture.
If the rise in silver prices were just an average of previous uptrends, then silver's price would approach $24 by the end of March 2020.
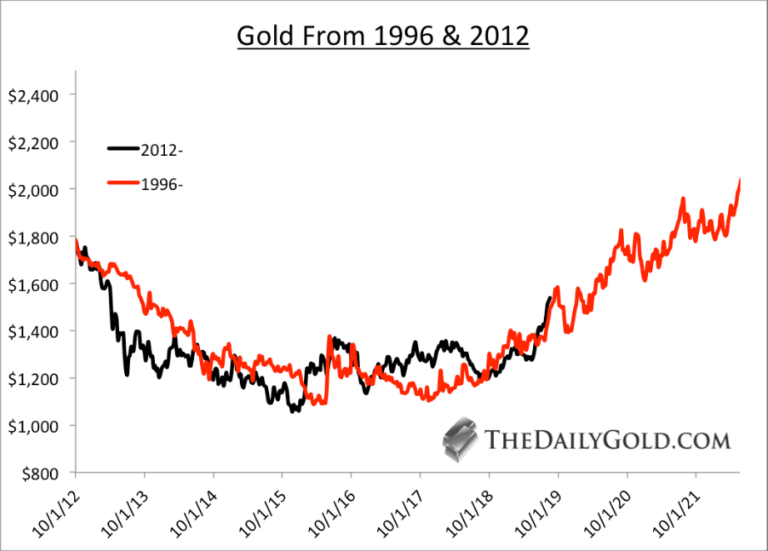
On the price development of gold
Gold is more challenging, as there is no obvious comparison point in a bull market*. The most significant lows in gold prices were experienced in 1970, 1985, and 1999 – 2001.
When examining the preceding bear market, the best comparison to the recent bear market and the current bull market is, however, from the late 1990s and early 2000s.
Note that we are not predicting a repetition of the events from 2003-2006 in the next three years. It is possible, but we solely assert that the period from 2012-2019 resembles the period from 1996-2003 the most.
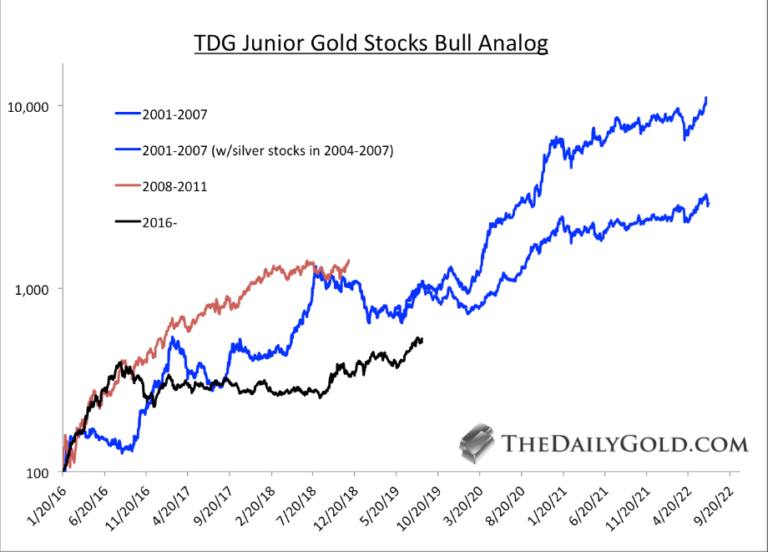
Gold stocks and junior stocks
This image compares how gold stocks, and especially junior gold stocks, bottomed out in 2016 compared to the lows experienced in 2001 and 2008.
Note that the basket of 20 stocks we are comparing is quite strong compared to GDXJ:
In our new book, we argue that the lows experienced in gold stock prices in 2016 are very comparable to the lows of 1957.
Below, we compare the lows of 1957 and 2016 to the data from Barron’s Gold Mining Index, where the value increased 40-fold from the 1957 low to the peak in 1980.
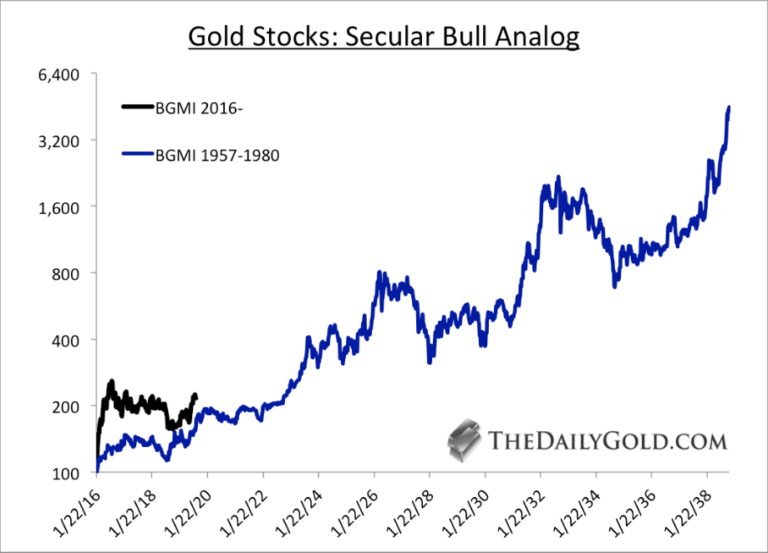
Therefore, there is significant growth potential in precious metals if gold remains in a bull market.
Gold could fundamentally maintain its bull trend until the next phase of economic recovery is seen. This could take anywhere from a few years to four years.
If the price of gold continues to develop in a manner similar to the early 2000s, the value could rise to $3000 per ounce by the beginning of 2023.
*Translator's note: in the article, a bear market refers to a declining trend in precious metal prices, while a bull market refers to a rising trend.
Original article: https://www.investing.com/analysis/new-gold-and-silver-bull-analogs-200459113